While creating and maintaining your website you may encounter various issues, bugs and misconfigurations. One of the ways to diagnose your problems is by enabling debug log or mode of your WordPress website.
Step 1 – Access WordPress Files
Sometimes you may not be able to do everything from WordPress admin due to restricted permissions on your server’s file system. As a result you may need to directly access WordPress files stored on your server. Depending on your hosting provider there might be multiple ways how to access the files:
- Using SFTP or FTP protocols and third party programs like FileZilla, CyberDuck.
- Access files directly from you hosting providers account page using cPanel or alike tools.
- Using SSH keys to connect over Terminal (Advanced).
Step 2 – Locate Your Website Directory
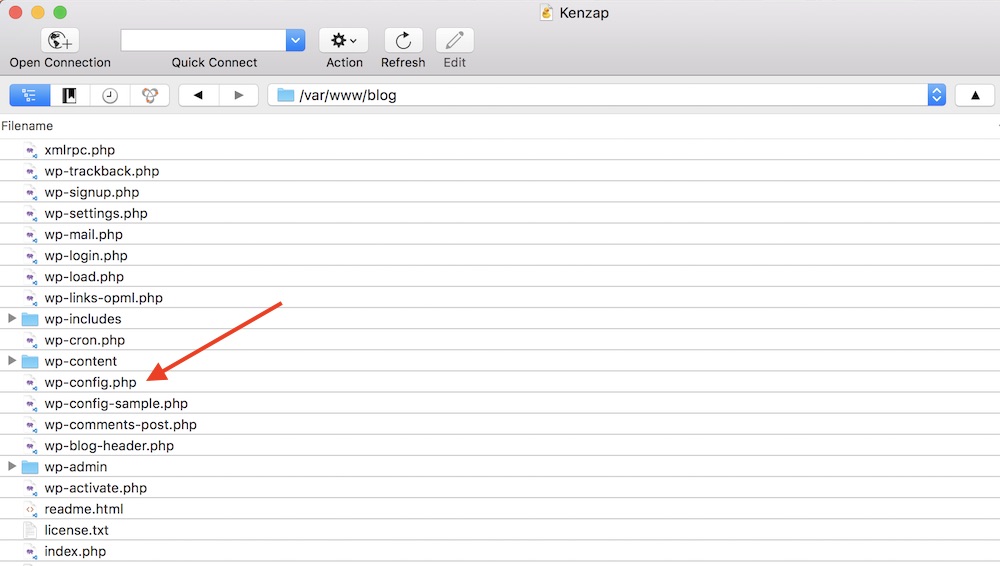
It may happen that your server has multiple WordPress installations hosted under different domain names. Make sure that you find exactly that folder that hosts your website you want to debug. In our case the root folder is /var/www/blog/ but it also might be /usr/home/blog/ or any other directory.

Step 3 – Enable Logging
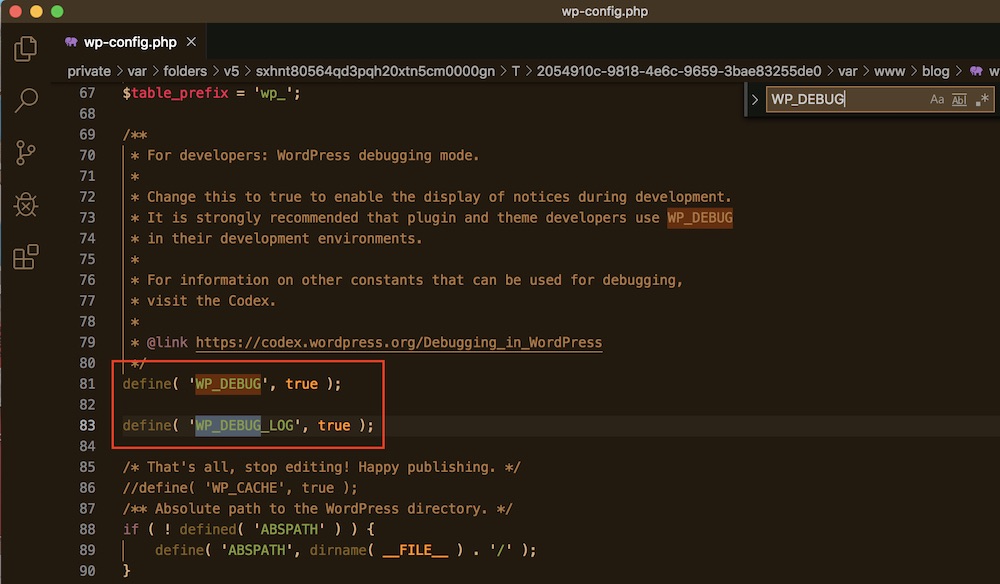
As shown on the image above there is wp-config.php file. Open it and make sure these two lines of code are placed in the file:
- define( ‘WP_DEBUG’, true );
- define( ‘WP_DEBUG_LOG’, true );
Also verify that WP_DEBUG and WP_DEBUG_LOG declarations are only placed once in this file to avoid configuration conflicts.

Step 4 – Debugging Website
You will now be able to access debug.log file located under wp-content folder. In our case its /var/www/blog/wp-content/debug.log. Unfortunately all your previous errors and warnings will not show up here automatically. You now need to reproduce the steps on your website that triggers warning or errors.
After this you may be finally able to see debug.log file for any errors and warning.